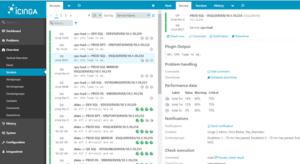
At BCS we use World Class Open Source monitoring software to monitor everything from perfmon data of your SQL Servers (our specialty), including workstations, routers, firewalls, appliances and more. From service states up/down, to ping ‘IsAlive’ checks to custom queries – like how many orders are coming in, Zero? Alert!
The beauty of this solution is scalability at no additional cost. The Open Source community provided software is for all to use free of licensing cost. From 1 server to hundreds in multiple datacenters and clouds, Icinga is arguably the best tool on the market!
Icinga runs on Linux, we prefer CentOS 7, so the Operating System to host Icinga is itself Open Source and free of license cost!
The dashboard is very intelligent and full of datapoints, everything customizable from email alerts to threshold configurations, to pop up attention getters when cautions or critical warnings arise.
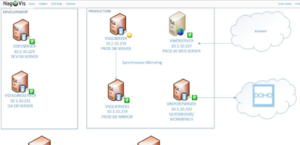
An elegant integrated solution is NagVis. NagVis allows Icinga to integrate with your network map. Now you can build a great wall monitor for Help Desk to see exactly where problems are in your ecosystem.
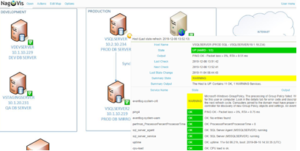
We find it a great tool for production support staff to quickly get up to speed, but more importantly quickly find problem spots when the vague calls flood in ‘System is Slow’. Quickly see server purposes, network configuration and visibility of what is what, and which one exactly may not be healthy.
Hover your mouse to see exactly what is wrong.
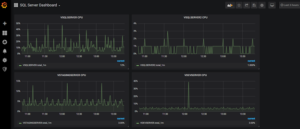
And bringing it all together with Grafana, another great wall monitor to see performance outliers. This free Open Source dashboarding tool is the icing on the monitoring-cake for BCS. We find it a great tool to replace email alerts for cpu load, or high memory consumption, as the chart is automatically refreshing the current values and makes available historical data for root cause analysis. Even add your order counts for custom visuals!
